Destra Multi-Alternative Fund (NYSE: DMA)
Sub-Advised by Validex Global Investing
MARKET PRICE DISTRIBUTION RATE1
17.90%
As of 7/30/26
Premium/(Discount)
(14.80%)
as of 7/30/26
Market Price
$7.54
as of 7/30/26
Net Asset Value
$8.85
As of 7/30/26
1 Monthly distribution per share annualized and divided by the July 30, 2026 market price per share. The distribution rate alone is not indicative of Fund performance.
Objective
The Destra Multi-Alternative Fund (the “Fund”) is an exchange-listed closed-end fund that seeks returns from income and capital appreciation by allocating across multiple alternative sleeves, including alternative income, dynamic/hedged strategies, and direct private equity.
By emphasizing differentiated return drivers, the Fund is designed to pursue outcomes that may be less tied to broad equity and fixed income market cycles, while maintaining the accessibility and transparency of an exchange-listed vehicle.
What this means for investors
A single-ticker approach to alternatives that can serve as a core “alts allocation” component or a diversifier alongside traditional portfolios.
There is no guarantee that the Fund will achieve its investment objective, generate profits, or avoid losses.
| Vehicle | Exchange-listed CEF |
|---|---|
| Ticker | DMA |
| Structure | Multi-strategy alternatives |
| Focus | Income + opportunistic growth |
Strategy
The Fund allocates across three primary sleeves designed to pursue a blend of income and opportunistic growth while seeking diversified drivers of return.
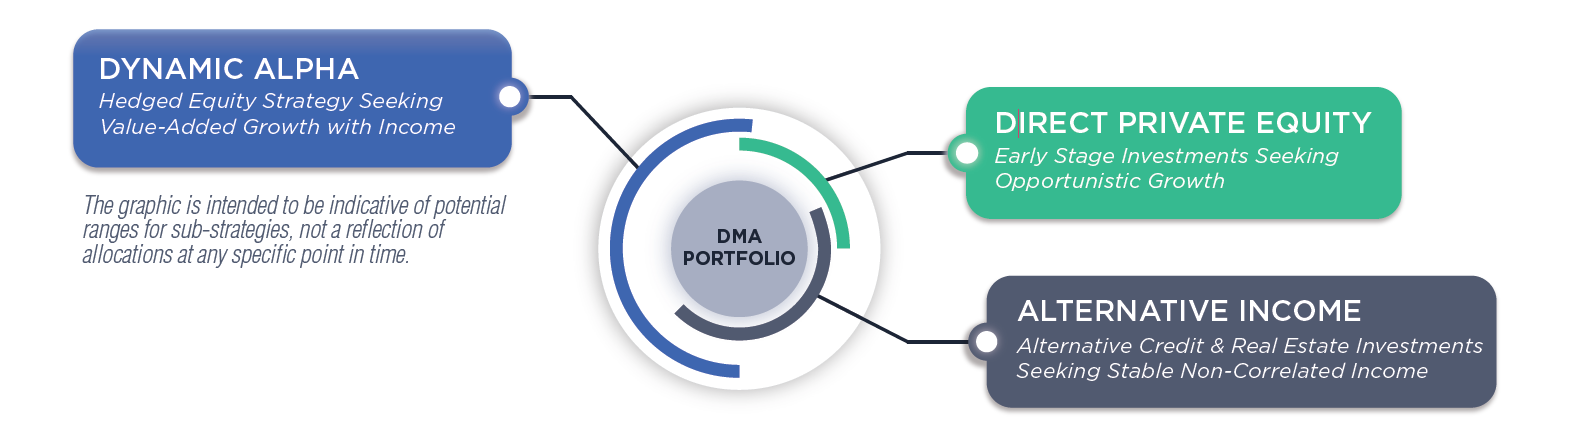

Hedged equity strategy seeking value-added growth with income. Focuses on identifying turning points and managing downside through risk-mitigation techniques.

Opportunistic early-stage and growth investments intended to capture long-horizon value creation in differentiated private market opportunities.

Alternative credit and real estate investments seeking stable, non-correlated income and the potential to benefit from illiquidity premiums.
There is no guarantee that any investment strategy will achieve its objectives, generate profits, or avoid losses.
Target sleeve allocations (as of 6/30/26)
| Sleeve | Allocation |
|---|---|
| Dynamic Alpha | 28% |
| Direct Private Equity | 40% |
| Alternative Income | 24% |
| Cash | 9% |
Allocations shown are as of 6/30/26 and subject to change.
Performance
Average annual total returns shown below reflect past performance as of the stated date. Market price returns will differ from NAV returns and may be materially impacted by premium/discount dynamics.
| Share Class | Ticker | 3 MO | 6 MO | 1YR | 3YR | 5YR | 10YR | From Incep.* |
|---|---|---|---|---|---|---|---|---|
| Market Price | DMA | -3.51 | -9.24 | -1.01 | 22.92 | n/a** | n/a** | n/a** |
| NAV | XDMAX | -4.27 | -5.40 | -2.93 | 0.14 | -0.87 | 0.31 | 2.05 |
Source: Morningstar
Data presented reflects past performance, which is no guarantee of future results. Investment results and principal value will fluctuate so that shares, when redeemed, may be worth more or less than their original cost. Due to market volatility, current performance may be higher or lower than the performance shown. Call 877.855.3434 or access our website at destracapital.com for performance current to the most recent month end. Returns for period of less than one year are not annualized, and include reinvestment of all distributions. The Fund’s Gross/Net Expense ratios are 2.42%/2.05%.
** The Fund listed on the NYSE on 1/13/22.
Investors cannot invest directly in an index and index returns do not reflect any fees, expenses or sales charges directly in an index.
Investors buy and sell shares at the MKT rate now that the Fund is listed. The risk metrics and performance stats shown here are at NAV since inception of the Fund and reflect the performance of the underlying portfolio. MKT price can and usually does deviate from NAV, sometimes significantly.
12-Month Distribution History*
Jul 2025 – Jun 2026
*The Fund reintroduced a monthly distribution program in March 2025.
Portfolio and Fund Characteristcs
| Ticker | DMA |
| NAV Ticker | XDMAX |
| CUSIP | 250 65A 502 |
| Fund Inception Date | 3/16/2012 |
| NYSE Listing Date | 1/13/2022 |
1 The closing price at which the Fund’s shares were traded on the exchange.
2 Per-share dollar value of the Fund, calculated by dividing the total value of all the securities in its portfolio, plus any other assets and less liabilities, by the number of Fund shares outstanding.
as of 6/30/26
| Market Price1 | $7.48 |
| NAV2 | $8.96 |
| Premium/(Discount) | (16.52%) |
| Average 30-Day Volume | 18,404 |
| Net Assets | $80M |
| Leverage Outstanding | $10M |
| Total Leverage Ratio | 10.95% |
| Manager | Destra Capital Advisors LLC |
| Sub-Advisor | Validex Global Investing |
as of 6/30/26
as of 6/30/26
| Canyon CLO Fund III | 13.57% |
| Clear Street Group Series B Preferred | 7.31% |
| AlwaysAI, Inc. Series C Preferred Stock | 5.16% |
| Fidelity Treasury Portfolio Open-End Fund | 5.07% |
| Canyon CLO Fund II | 4.95% |
| AlwaysAI, Inc. Series C-1 Preferred Stock | 4.73% |
| Nurture Life, Inc Series B-1 Preferred Stock | 4.03% |
| Fidelity Government Portfolio Institutional Class | 3.95% |
| Copia Wealth Studios Series Seed-2 Preferred | 3.43% |
| Alphawave-1 LLC 10% Due 06/05/2027 | 3.04% |
Holdings are subject to change without notice. There is no assurance that the investment process will lead to successful investing. All compositions are subject to daily changes with market actions.
| BlackRock Enhanced Equity Dividend Trust | |
| Blackstone Strategic Credit 2027 Term Fund | |
| Cohen & Steers Quality Income Realty Fund Inc | |
| Cohen & Steers Real Estate Opportunities and Income Fund | |
| FS Credit Opportunities Corp | |
| Neuberger Berman Real Estate Securities Income Fund Inc | |
| Nuveen Real Asset Income and Growth Fund | |
| Nuveen Real Estate Income Fund | |
| Principal Real Estate Income Fund | |
| Royce Micro-Cap Trust Inc | |
| Virtus Dividend Interest & Premium Strategy Fund | |
| Voya Global Advantage and Premium Opportunity Fund | |
| XAI Octagon Floating Rate Alternative Income Term Trust |
The DMA Exchange Listed Trading Group represents closed-end funds that have been chosen to reflect alternative, non-traditional, and specialty investment strategies, that in aggregate may provide a reference for performance and trading of the Destra Multi-Alternative Fund.
*AIF has been removed from the initial peer group due to pending merger announcement into BDC structure.
Portfolio Managers
Validex Global InvestingValidex Global Investing seeks growth at the edge of inflection. Their proprietary research aims to identify emergent turning points as they unfold, pairing high-conviction opportunities with sophisticated risk-mitigation strategies across both private and public markets. Investment TeamMark Scalzo |

|
Literature & Communications
Marketing Materials
Regulatory Documents
Press Releases
Webcasts
Distributions
Glossary
Gross Expense Ratio: Expense ratio is a measure of what it costs to operate an investment, expressed here as a percentage of its assets. These are costs the investor pays through a reduction in the investment’s rate of return. The gross expense ratio is the total annual fund or class operating expenses directly paid by the fund from the fund’s most recent prospectus (before waivers or reimbursements). This ratio also includes Acquired Fund Fees & Expenses, which are expenses indirectly incurred by a fund through its ownership of shares in other investment companies. Net Expense Ratio: Expense ratio is a measure of what it costs to operate an investment, expressed here as a percentage of its assets. These are costs the investor pays through a reduction in the investment’s rate of return. The net expense ratio is the total annual fund or class operating expenses directly paid by the fund from the fund’s most recent prospectus, after any fee waiver &/or expense reimbursements that will reduce any fund operating expenses. This ratio also includes Acquired Fund Fees & Expenses, which are expenses indirectly incurred by a fund through its ownership of shares in other investment companies. This number does not include any fee waiver arrangement or expense reimbursement that may be terminated without agreement of the fund’s board of trustees during the one-year period.
Alpha: A measure of performance on a risk-adjusted basis. Alpha compares the volatility (price risk) of the Fund to risk-adjusted performance of the benchmark Index. The excess return of the Fund relative to the return of the Index is the Fund’s alpha.
Beta: A measure of a fund’s sensitivity to market movements - market movements are represented by a benchmark index. A benchmark index has a beta of 1.0. A beta greater than 1.0 indicates that a fund’s historical returns have fluctuated more than the benchmark index. A beta less than 1.0 indicates that a fund’s historical returns have fluctuated less than the benchmark index. Correlation: a statistic that measures the degree to which two securities move in relation to each other.
Excess Return: Excess returns are returns achieved above and beyond the return of a proxy.
Market Capture Ratios: A statistical measure of the Fund’s overall performance in up-markets (positive return periods) and down markets (negative return periods). The ratio is calculated by dividing the Fund’s returns by the returns of the index during the up-market or the down-market, and multiplying that factor by 100.
R2: R-squared measures the relationship between a fund and a benchmark. A higher R2 (closer to 100%) indicates that the portfolio moves like the benchmark.
Sharpe Ratio: A measure of historical risk-adjusted performance calculated by dividing the fund’s excess returns over a risk-free rate by the standard deviation of those returns. The higher the ratio, the better the fund’s return per unit of risk.
Sortino Ratio: The Sortino ratio is a variation of the Sharpe ratio that differentiates harmful volatility from total overall volatility by using the asset’s standard deviation of negative portfolio returns deviation, instead of the total standard deviation of portfolio returns.
Standard Deviation: An annualized statistical measure of how much a fund’s returns have varied over a period of time. The more variable the returns, the higher the standard deviation. A higher standard deviation also indicates a wider dispersion of past returns and thus greater historical volatility.
Bloomberg Barclays US Aggregate Bond Index - measures the performance of the U.S. investment grade bond market.
IA SBBI US 30 Day T-Bills Index - measures the performance of one-month maturity US Treasury Bills.
Morningstar Broad Hedge Fund Index – rules-based, asset-weighted index designed to capture the performance of the most investable hedge funds.
Morningstar Diversified Alts Index - provides diversified exposure to alternative asset classes in the ProShares ETF lineup.
Morningstar US Fund MultiStrategy Category - Multistrategy funds allocate capital to a mix of alternative strategies (at least 30% combined), as defined by Morningstar’s alternative category classifications.
S&P 500 Index – measures the performance pf the largest 500 U.S. common stocks chosen to reflect the industries in the U.S. economy.
Risks
Investing in the Fund involves risks, including the risk that you may receive little or no return on your investment or that you may lose part or all of your investment. Please see below risk for underlying holdings of the fund. Future distribution rate amounts, if any. are expected to be paid annually from ordinary income received and net capital gains realized from the disposition of Fund investments. Distribution amount is not indicative of Fund performance. Current distributions and target yields are not guaranteed and may not be met in the future. Shareholders receiving periodic payments from the Fund may be under the impression that they are receiving net profits. However, all or a portion of a distribution may consist of a return of capital. A portion of the Fund’s distributions consisting of a return of capital are often based on the character of the distributions received from the underlying holdings, primarily real estate investment trusts. Investing involves risk including the possible loss of principal. Alternative investment funds, ETFs, mutual funds, and closed-end funds are subject to management and other expenses, which will be indirectly paid by the Fund. Issuers of debt securities may not make scheduled interest and principal payments, resulting in losses to the Fund. Typically, a rise in interest rates causes a decline in the value of fixed-income securities. Lower-quality debt securities, known as “high-yield” or “junk” bonds, present greater risk than bonds of higher quality, including increased default risk and non-diversification risk as the funds are more vulnerable to events affecting a single issuer. The use of leverage, such as borrowing money to purchase securities, will cause the Fund to incur additional expenses and will magnify the Fund’s gains or losses. Investments in lesser-known, small- and medium-capitalization companies may be more vulnerable than those in larger, more established organizations. The value of a structured note will be influenced by time to maturity; type of note; market volatility; changes in the issuer’s credit quality rating; and economic, legal, political, or geographic events that affect the reference index.
Validus Growth Investors LLC (dba “Validex Global Investing”) is the Fund’s sub-advisor. Destra Capital Advisors LLC, a registered investment advisor, is the Fund’s investment manager and is providing secondary market servicing for the Fund.